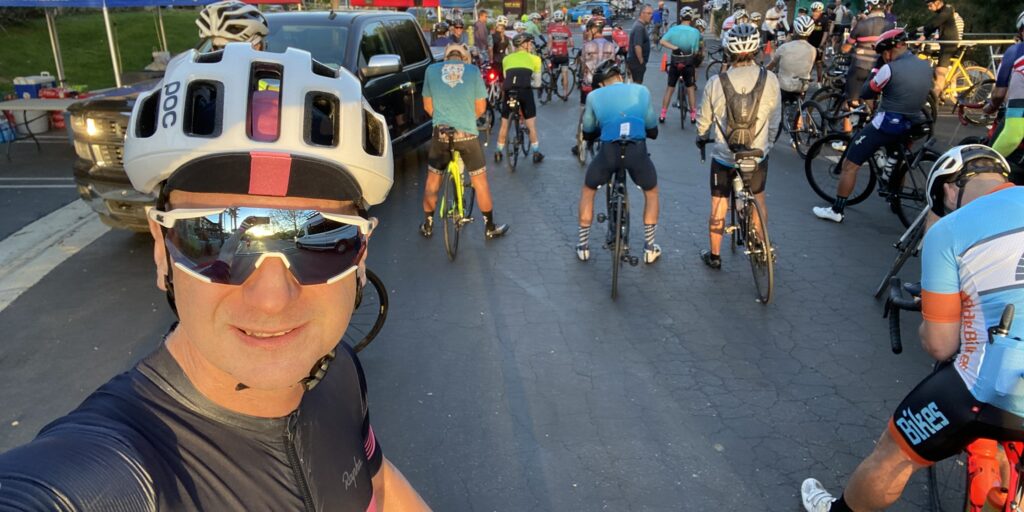
On Saturday, April 9, 2022, I completed the Mulholland Challenge, a 170-kilometer (106-mile) event that started in Agoura Hills, California, and traversed many of the iconic climbs of the Santa Monica Mountains, with over 3,700 meters (12,100+ feet) of climbing.
This was my first “event” following my recovery from the Achilles tendonitis that I had been dealing with since the beginning of the year. Over the past few months, I have been working to gradually increase my volume in terms of hours, distance, and elevation gain, in preparation for some double centuries that I am planning to ride later in the year. My attitude going into this event was that I would treat it as a training ride. I did not specifically train for this event, nor did I do any reconnaissance of the route prior to the event. Although I had previously ridden some portions of the route, many roads were either unfamiliar to me or I had ridden them in the reverse direction.
Decker Canyon is one such example. I had previously descended Decker Canyon to Pacific Coast Highway, but had never climbed it. As discussed below, it would have been beneficial to have done this and other climbs that I would face on the Mulholland Challenge, prior to the day of the event.
The Route
Below is a copy of the official Mulholland Challenge route for 2022 on Ride with GPS:
Major Climbs:
- Topanga Canyon. A 2.83 km Category 3 climb, averaging 5.2% gradient.
- Old Topanga Canyon. A 6.62 km Category 3 climb, averaging 3.5% gradient.
- Stunt Rd. A 6.36 km Category 2 climb, averaging 6.6% gradient.
- Westlake Blvd. A 3.5 km Category 3 climb, averaging 7.2% gradient.
- Yerba Buena. A 4.38 km Category 4 climb, averaging 5.1% gradient.
- Cotherin Road. A 1.65 km Category 4 climb, averaging 8.3% gradient.
- Decker Canyon. A 5.89 km Category 2 climb, averaging 7.8% gradient.
The distances, categories, and gradients listed above are from the corresponding segments in Strava. On paper, the “major” climbs do not seem like much. After all, the longest of these does not exceed 7 km. As I was reviewing the climbs on my Garmin head unit in the hotel room the evening before the event, I said to myself, “Okay, no big deal.” However, this course was probably a “death by a thousand cuts” situation—the cumulative effect of these 7 “major” climbs and the other 8 or 9 minor climbs made this a challenging century ride.
Descents:
- Piuma Rd
- Yerba Buena
- Deer Creek
- “The Snake” (Mulholland)
I had previously ridden up “The Snake,” and this was my first time descending that section of Mulholland. It is closed to traffic, and some construction is being done on it, apparently in an attempt to get it reopened to traffic at some point. There was a very short section of gravel and due to uncertainty I had regarding the condition of the road, I decided to take the descent somewhat slower than usual.
This was my first time descending Deer Creek, and it really stands out as one of the highlights of the ride. It is a long, fast descent with an amazing view of the Pacific Ocean. After spending several hours in the hot Santa Monica Mountains, the cool ocean breeze was just what I needed.
The Weather
When I started the ride at 7:09 a.m., the temperature was cool. At the time, I knew that it was going to heat up later in the day, and early on I endeavored to make sure that I was keeping up on my hydration. I knew I was going to be sweating a lot later in the day. Unfortunately, somewhere along the way, I blew it!
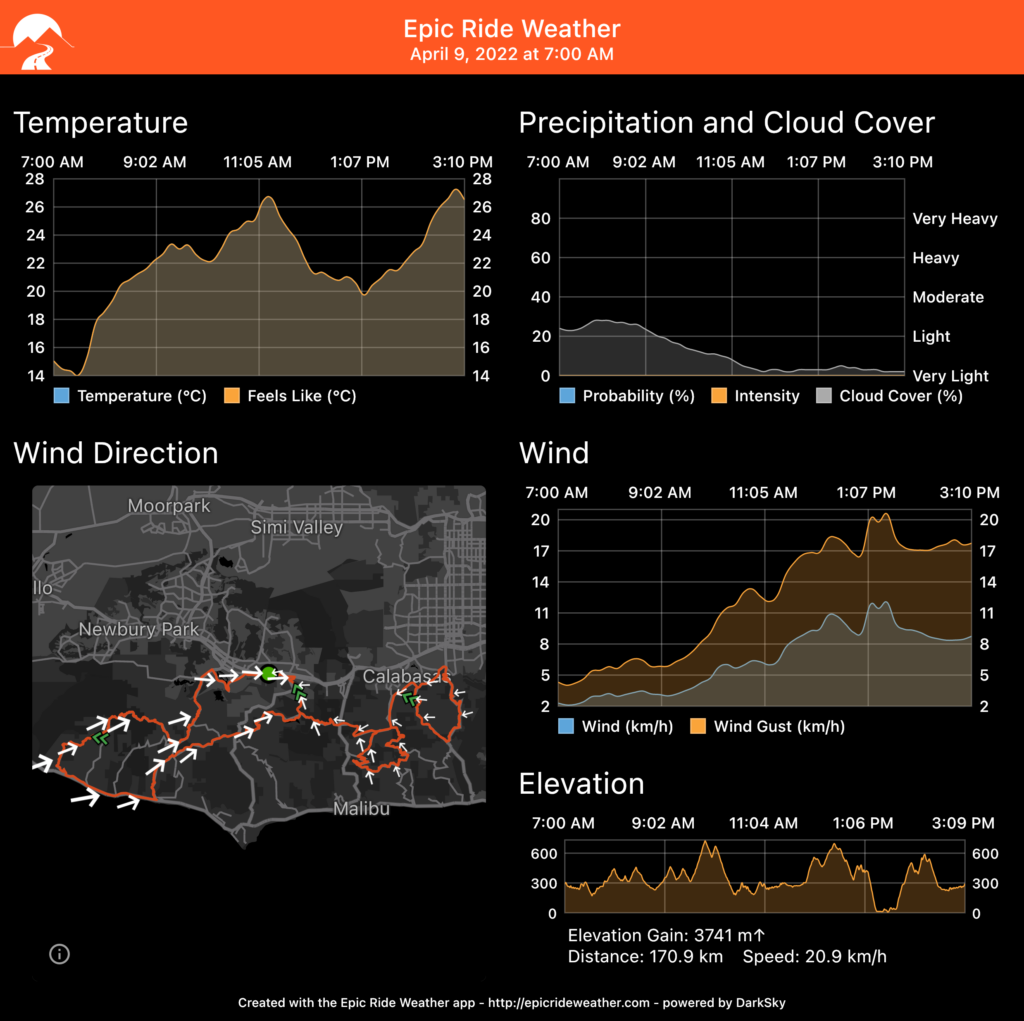
The Epic Ride Weather forecast paints a much more temperate climate than what I actually faced out on the course. As shown, Epic Ride Weather indicates that the max temperature is about 27ºC, but it certainly felt much, much hotter! Perhaps my Garmin recorded a more accurate reading of the conditions that day? Here’s a graph of the temperature recorded by my Garmin with an elevation overlay.
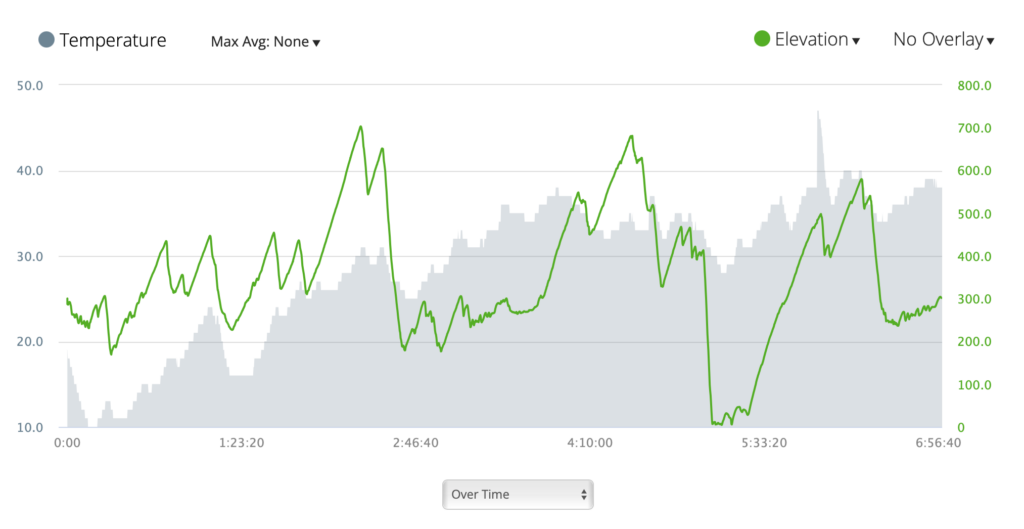
I don’t know how accurate the Garmin’s temperature sensor is, but it seems much closer to the reality than what Epic Ride Weather depicts.
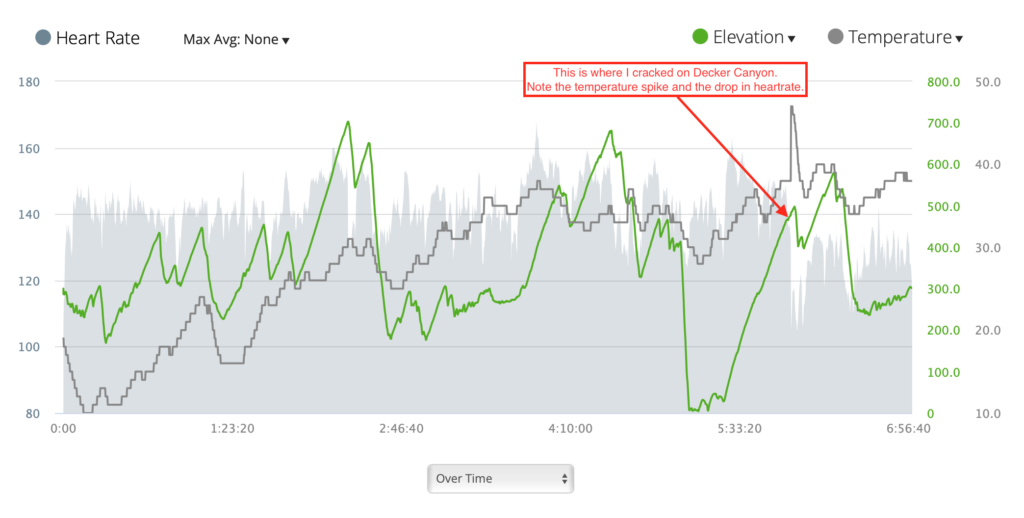
Cracked on Decker Canyon
When I got to the base of the climb on Decker Canyon Road, I believed I was on-pace for a 6.5-hour finish. Unfortunately, I did not realize that I had drastically fallen behind in hydration by that point. Moreover, I did not foresee that the temperature on Decker Canyon was going to increase substantially. These factors, combined with the steep gradient, worked together to break me.
In addition, I believe that if I had been more familiar with the climb and the weather patterns in this canyon, it may have helped me to throttle my effort in the early stages of this particular climb, giving me a better shot at making it up to the summit without running into the problems that I did, despite my hydration status.
I then resumed my ride, determined to finish the course. Unfortunately, I was still worried about my leg cramping up and I lacked the energy to ride at endurance tempo (power zone 2.5 – 3.5). But it was only 25 km to the finish line, with a nice descent down “The Snake” and no significant climbs remaining in the ride. Just easy spinning to the end.
My Results
According to my Garmin, I finished the ride with 6 hours and 59 minutes of actual moving time. The official Planet Ultra time of my ride, based on the timing chip, was 7 hours, 29 minutes, and 1 second. Not a particularly great result, but it put me in the top quartile of the 100+ riders who completed the course. View the official Planet Ultra Results page.
Here is the Strava activity:
What I Could Have Done Better
If I had paid more attention to both my nutrition and hydration, I am certain that I would not have experienced any problems on Decker Canyon, and I would have finished the ride, potentially, an hour sooner.
I have been using Garmin’s “Smart” hydration and nutrition alerts to remind me to eat and drink, but often I either do not see the alerts, because I am focused on the road, or I do see the alerts, and I defer acting on the alerts due to a situation happening on the road. On paper, however, the “Smart” alerts seem like a good idea, because they are tied to things like temperature, heart rate, power, etc.
I wish that Garmin had a way for me to record my consumption of nutrition and hydration during the ride, and then allow me to review when and how much I consumed on a table or graph. This would, potentially, allow me to have better visibility into what I am actually doing during the ride and take corrective action.
Alternatively, I am thinking I should just go back to exclusively time-based consumption.
How do you keep up with your hydration and nutrition on long rides?
Looking Ahead
I will be riding in the Mt. Laguna Classic next week, on April 23, 2022. That event is Stage #2 in Planet Ultra’s King of the Mountains Century Challenge. I’ve never ridden in the Pine Valley area, and I am looking forward to some new scenery, although I am guessing it is going to be HOT!
Like the Mulholland Challenge, I am approaching this as a training ride, and I will be implementing some changes to my nutrition and hydration plan.